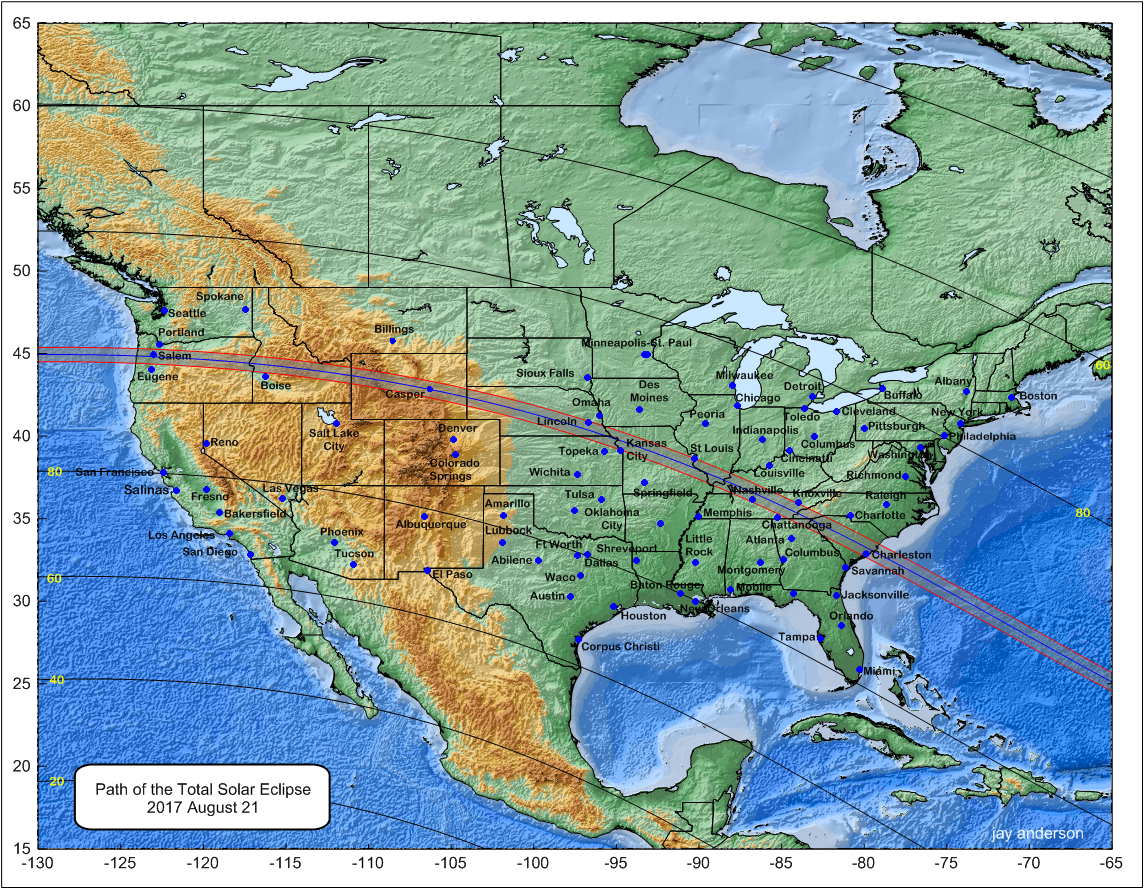
Figure 1: Low-resolution map of the eclipse track across the United States. The annotated lines parallel to the track of the shadow show the percent of the Sun blocked by the passing Moon.
图1:低分辨率日食轨迹美国地图。平行于轨迹的注释为各地日食食分。
Early Weather Prospects for the 2017 Eclipse
2017年日食的早期天气预测
This eclipse arrives at a propitious time: the summer thunderstorm season is winding down and retreating southward; the Arizona monsoon is breaking; and the storm-carrying jet stream has not yet begun its journey southward from Canada. The dry and generally sunny fall season is about to begin. After a 38-year eclipse drought, this one arrives to the open arms of a friendly August climatology. The best weather prospects are found in the west and midwest, but weather forecasting has now reached a level of accuracy that movement to a favourable area can be planned several days or a week in advance.
此次日食发生的时机非常好:夏季雷雨季节即将结束并且转为南下;北美季风(亚利桑那季风)暂停;带来风暴的高速气流还没有开始从加拿大南下。干燥和阳光充足的秋季即将开始。在结束38年未发生过日食之后,这一次日食将受到八月良好气候的热情欢迎。最乐观的天气应该是在西部和中西部,但天气预报现在已经达到能够提前几天或一周规划转移到天气良好地点的准确程度。
The westerly winds that bring weather systems onto the North American continent first have to cross the mountain barriers that border the Pacific coast. The moisture-laden air is forced to rise up the windward slopes, giving seaward-facing Washington and Oregon unfortunate reputations for cloud and precipitation. It’s an undeserved bad rep, as the cloud is confined mostly to the coast and only a short move inland will bring some of the best weather of the track. To top it off, August is not really a very wet and cloudy month to begin with. The diminutive Coast Range is sufficient to erase the cloud from the sky, giving the Willamette Valley and the city of Salem some very fine eclipse weather.
影响北美大陆的西风首先必须跨域太平洋沿岸的山脉屏障。富含水分的空气被迫沿着迎风坡上升,给华盛顿州和俄勒冈州沿海地区带来不幸的云和降水。这是不应有的坏名声,正因为这些云绝大多数被局限在沿海地区,只有极少数移动到内陆,因此才能造就日食带上最好的天气。值得庆幸的是,八月并不是非常潮湿和多云的月份。较为低矮的沿海山脉足以消除天空中的云,给Willamette山谷和塞勒姆市(俄勒冈州)带来适合日食的好天气。
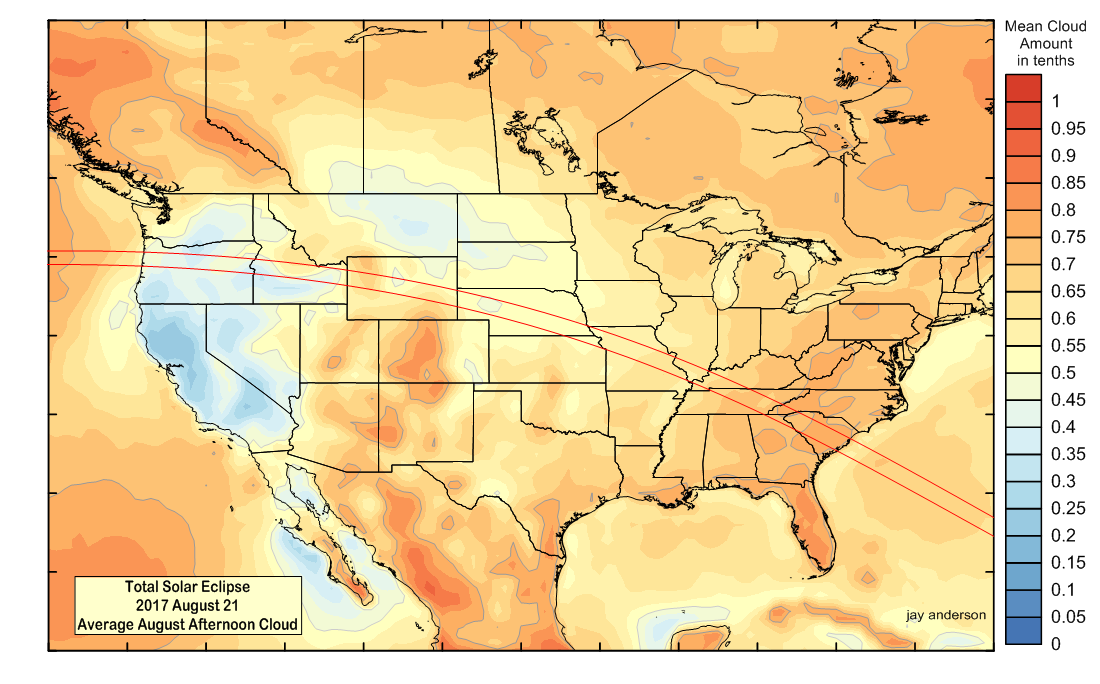
Figure 2: Eclipse-track map showing the average afternoon August cloudiness derived from 22 years of satellite observations. The 50 and 75 percent contours are outlined. Best weather prospects are found in northern Oregon, Idaho, central Wyoming, and western Nebraska. The resolution in this figure is 1° x 1° in the original dataset. Data: CIMSS/NOAA/UW-Madison.
East of Salem, the eclipse track crosses the Cascade Mountains and the cloudiness bumps up a touch – not enough to detract from the appeal of watching an eclipse from the majesty of a beautiful range of mountains. Once over the Cascades, the eclipse path moves onto the Columbia River Basin, where it finds the very best weather conditions anywhere along the track. Even though the summer months are already notable for their abundant sunshine, the Cascade mountains manage to extract the little moisture remaining in the Pacific westerlies, giving Madras, Oregon, and its surroundings along the Deschutes River a very low average cloud cover, as seen in both the satellite cloud observations in Graph 1 and the surface-based observations at Redmond in Table 1. In the recent past, few eclipse tracks have been able to offer such a low average cloudiness.
East of Madras, the cloud cover rises across the central and eastern portions of the Columbia Basin. Part of this is because of the terrain, which rises into a rougher series of small mountains, but the area is also the breeding ground for summer thunderstorms when enough moisture creeps into the plateau. Over the eastern Plateau, midsummer precipitation is about 70 percent more than on the leeward slopes of the Cascades near Madras, but both are noted for their dry desert-like climate.
The Columbia Basin is interrupted along the Idaho state line by the Snake River Valley. Once again, the westerly Pacific winds must drop to lower altitude, drying adiabatically as they descend and creating another region of very promising cloud cover climatology near Huntington, Oregon, and later in the Payete River Valley, at Cascade, Idaho. Given the uncertainties in the measurement of cloud cover by both satellites and humans, it is impossible to say that the Oregon-Idaho boundary has less cloud than the Deschutes River Valley, as the difference is no more than a few percentage points.
Past the Snake River Valley, cloudiness follows the terrain as the Moon’s path rattles across the Rockies. Each ascent is accompanied by an increase in cloudiness; each descent brings a Chinook-like drying and an increase in sunshine and eclipse prospects. The general trend in cloudiness is upward until the track finally descends onto the Great Plains for good at Casper, Wyoming. Thunderstorms are the main cloud-making culprit here, as the upper slopes of the Rockies, particularly Idaho and western Montana, are a storm nursery – storms that later head out onto the plains if moisture and wind conditions are right. They also start forest fires and eclipse chasers will have to monitor and move to avoid any smoke that may make its way onto the eclipse track, possibly from as far south as Arizona and New Mexico if upper winds are out of the south. Smoke tends to have a northeastward trajectory under the usual summer conditions, so points in Oregon and western Idaho are less likely to be obscured. If smoke is present in any amount, the eclipse may adopt an unbecoming pink colour, even though the Sun will be relatively high.
Though it lies on the east side of the Rockies and should have a dry climate, Casper is shown to have a relatively high cloud amount in the satellite statistics, but a very much smaller one – comparable to Madras – in the surface climatology. In this case, the surface record is preferred. Casper lies north of the Laramie Mountains, a spur of the Rockies that runs southeast-northwest rather than north-south, the general trend of the mountain chains. Satellite measurements have a footprint of 1 degree (about 100 km) on a side and the value at the location of Casper is capturing much of the cloud on the spur. The Laramie Mountains, covered with dark forests, have a tendency to form thunderstorms because of their low albedo, which, by absorbing sunlight, warms the slopes more strongly than the non-forested lowlands.
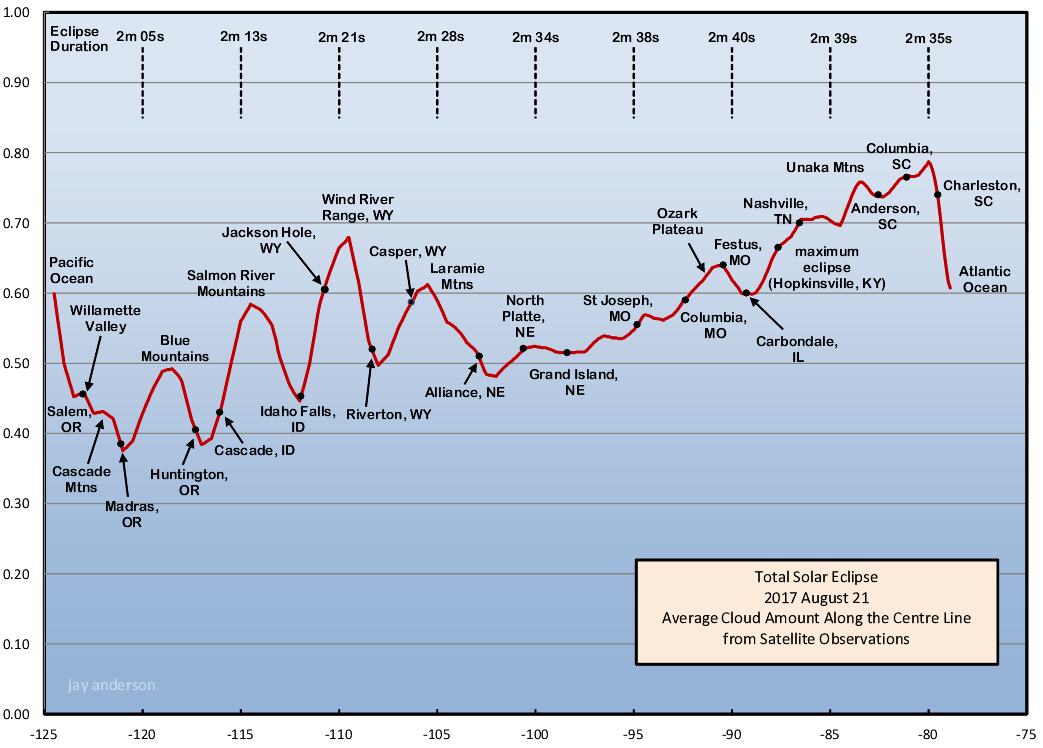
Graph 1: Average cloud cover along the eclipse centreline, extracted from 20 years of satellite imagery. Source: Patmos-X: CIMMS/ SSEC.
The ups and downs of mountain cloudiness fades away as the eclipse track moves out onto the Great Plains east of Casper and is replaced by a steady rise in cloudiness toward the Mississippi River. This trend is a reflection of the northward flow of moisture from the Gulf of Mexico that feeds the Plains thunderstorms in the warm months. From Nebraska to Missouri, average cloud cover as measured by satellite increases from about 50 percent to 65 percent. In the surface record, the increase is from around 25 percent to 45 percent. This dichotomy likely results from the sensitivity of the satellite sensors to thin high-level cloud, but human observers are also relatively insensitive to the same sky condition, tending to observe less cloud. In both measures, the lowest cloud amount along this part of the centreline is found to the west of North Platte, Nebraska.
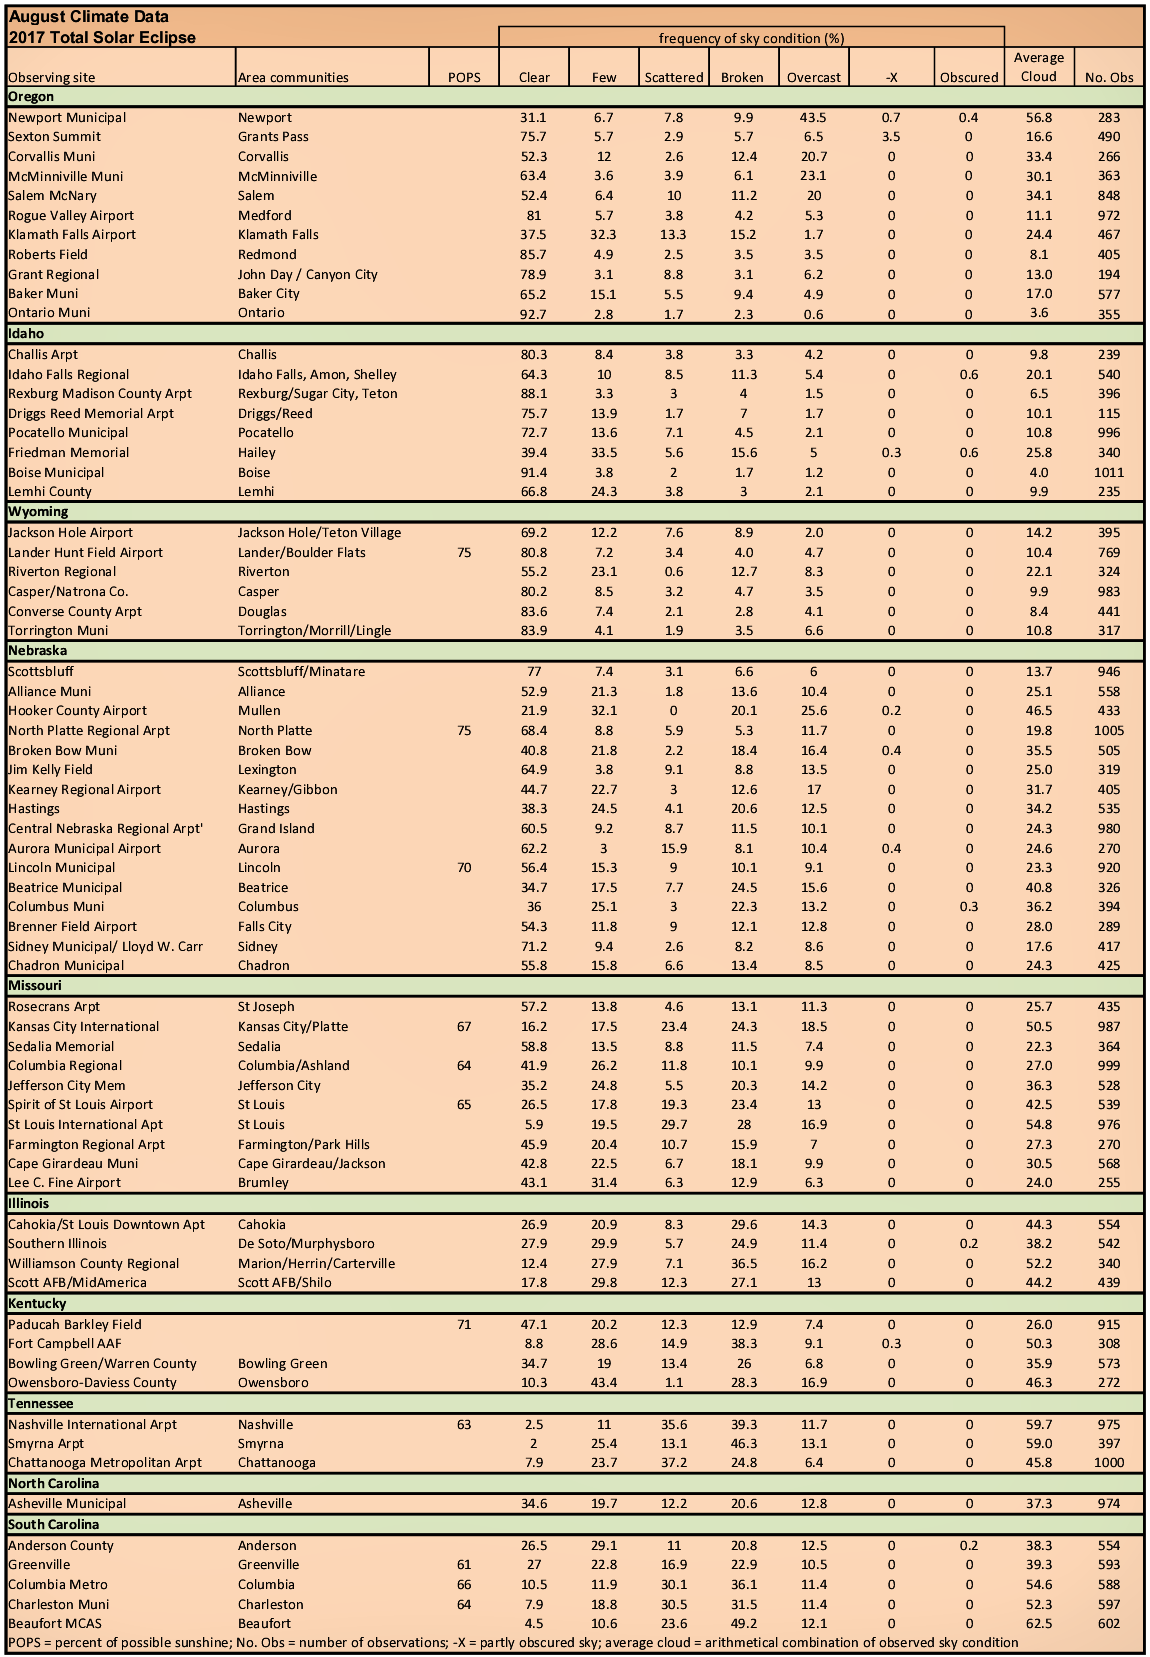
Table 1: Weather statistics collected from surface stations located along and close to the eclipse track. Note that all weather statistics, including those from satellites, have biases and errors. Use them for the comparison of one site with another, not the absolute probability of seeing the eclipse.
As the shadow track crosses through Missouri, it moves into rougher terrain of the Ozark Plateau south of St. Louis and cloudiness climbs more steeply, reaching a maximum at Festus, just before crossing the Mississippi River. The Ozarks are not particularly high, and so the cloud cover maximum is probably related to both the albedo of the forests and the air flow that must rise over the terrain. Cloudiness falls briefly over the flat landscape of southern Illinois, but begins a steady climb to a maximum on moving into Tennessee. After passing Nashville, the lunar shadow will begin the slow climb to the crest of the Appalachians, which is reached along the Tennessee-North Carolina border. Average cloudiness rises through the whole of this part of the track, peaking as high as 80 percent by satellite or just short of 60 percent in the surface data. The two datasets are in poor agreement in this part of the lunar path; the greatest cloud amount recorded by observers on the ground comes at Nashville, Tennessee, while the satellite record suggests a peak just short of the Atlantic Ocean, near Columbia. Of all of the states along the track, Tennessee may have the most complicated weather, as the terrain climbs from the Gulf Coastal Plain in western parts, to the Highland Rim in middle Tennessee and to the Cumberland Plateau with the Blue Ridge Mountains and all of its tributaries in the east. To complicate the terrain, the Nashville Basin provides a low-level haven in the Highland Rim, while the Tennessee River Valley does the same in the Blue Ridge Mountains.
The Appalachians are well known for their cloudiness at all seasons: on the western slopes, Gulf moisture is forced to rise; on the eastern slopes, Atlantic moisture is attracted inland and upslope. There is no substantial lee slope drying on either side of the eastern mountains, but individual valleys to benefit from the descent of air whatever the source, and so there is considerable up-and-down in the cloud averages, particularly in the surface-based observations.
The final descent to the Atlantic Ocean brings a small 7- or 8-percent improvement before the track heads out over the water. Some of this will be due to the suppression of convection by the cool breezes from the ocean.
Atlantic eclipe observers will have to be conscious of the hurricane season, which is well underway in late August. Fortunately, they are relatively uncommon on any single day, and so the likelihood of storm intervention is low. In their favour – skies tend to clear in the wake of a hurricane. Ship-board observers are likely to be more affected than those on land, as movement away from an approaching hurricane on the water will take place days in advance, and return to the track may be equally slow.
Some thoughts on Satellite- and Human-based Weather Observations
Satellites don’t observe clouds, they observe visible and infrared radiances and at night, only infrared radiances. Depending on the algorithm used to extract cloud information, they may be biased to over- or under-report high cloud or low cloud, or perhaps both. There are at least a half-dozen global cloud datasets, and they all give different estimates for cloudiness, sometimes by a very large amount. The dataset used to construct Graph 1 is the one that most resembles the surface observations.
Humans are far from perfect as well. In the table above, observers at the Spirit of St. Louis Airport and Lambert-St. Louis International Airport have observed very different cloud climatologies over the decades, though the two sites are only 26 km apart and observe much of the same sky. Humans tend to record too much cumulus cloud and probably discount thin cirrus, but the explanation for the differences at St. Louis defies complete explanation.
Use these data for comparative purposes, rather than absolute probabilities of seeing the eclipse. The percent of possible sunshine statistics are more reliable, but pertain to the whole day rather than the hours near maximum eclipse and are only available for a few sites. In general, human observations are 20 to 30 percent lower than satellite-based cloud estimates.
Summary
The United States has a sophisticated private forecast industry and a great resource in the National Weather Service. Reliable weather forecasts will be available for a week or more before the eclipse, and with a little mobility, no one who wants to travel to see this event should be disappointed.