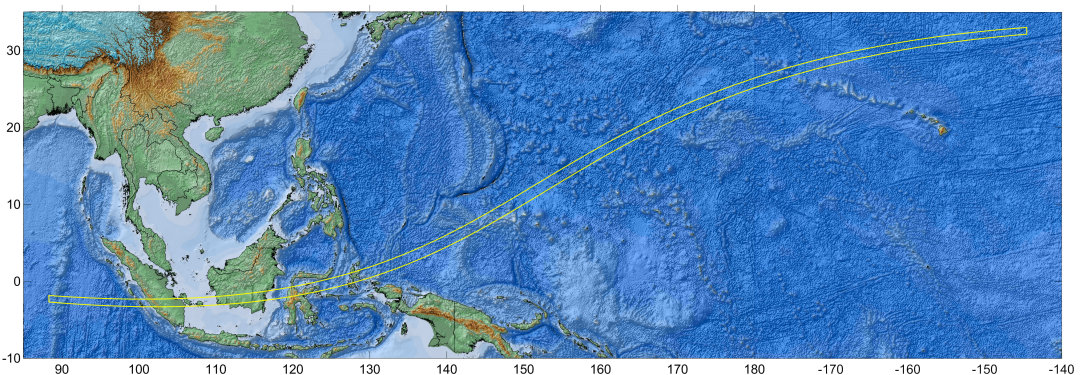
Figure 1: The eclipse track across Indonesia and the Pacific.
图1:跨越印尼和太平洋的全食带。
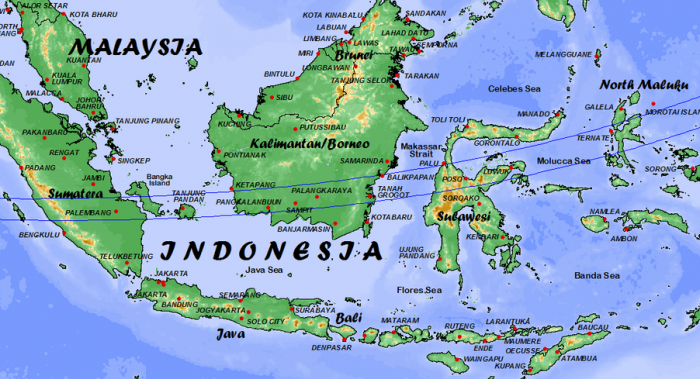
Figure 2: Indonesia Place Names and the Eclipse Track
图2:印尼地名和全食带
Climate Discussion for the 2016 Total Eclipse
2016 日全食天气分析
This March eclipse begins in the equatorial Indian Ocean west of Sumatera (Sumatra) and arcs northward to a sunset end in the high tropical latitudes north of Hawaii (Figure 1). The shadow passage begins at sunrise in the hot equatorial climate of Indonesia, under the influence of the Intertropical Convergence Zone and at the latter stages of the rainy monsoon season. Maximum eclipse comes in the mid-tropics, beneath the semi-permanent anticyclones (highs) that endow those latitudes with sunny skies and dry weather. In the afternoon of its passage, it moves into the trade wind circulation north of Hawaii, bringing a modest increase in cloudiness (Figure 2).
此次日全食始于苏门答腊以西的赤道印度洋,结束于夏威夷以北的高纬度热带地区(图1)。 全食带的日出部分属于印尼热赤道气候,处于雨季季风季节的后期阶段,受到热带辐合带的影响。最大食分出现在中热带,半永久性高压反气旋赋予那些地区晴朗的天空和干燥的气候。 全食带的下午部分,进入了信风流通的北方夏威夷,带来了云量的部分增长(图2)。
Except for a few tiny and difficult-to-reach islands in the Federated States of Micronesia, land-based sites (Figure 2) are restricted to Indonesia, primarily in Sumatera and on the islands of Kalimantan (Borneo), Sulawesi (Celebes), and North Maluku (Molucca). Both Sumatera and Sulawesi possess significant mountain and highland regions. The track across Kalimantan lies across the lower and flatter southern parts of the island, while the Maluku Islands have a rough but lower-level range of hills.
除了密克罗尼西亚联邦少数很小、难以到达的岛屿,陆上观测点(图2)仅限于印尼,主要是在苏门答腊,以及加里曼丹(婆罗洲)、苏拉威西、北马鲁古(摩鹿加)的岛屿。苏门答腊和苏拉威西拥有显著的山区和高原地区。 路径经过加里曼丹低洼和平坦的南部地区,而马鲁古群岛则是起伏而较矮的丘陵地带。
Indonesian climate is dictated by its geographical position, straddling the equator and affected by the annual movement north and south of the Intertropical Convergence Zone (ITCZ). The ITCZ is a belt of low pressure where the easterly trade-wind circulations from the Northern and Southern hemispheres meet, squeezing the lower levels of the atmosphere upward. The year-round equatorial heat and humidity over Indonesia and elsewhere in the tropics forms an atmosphere that is barely stable, ready to turn into convective clouds with the slightest disruption. The upward push brought on by the convergence of the ITCZ winds upsets the stability and the ITCZ is translated into a belt of frequent convective cloudiness and heavy precipitation.
印尼气候是由它横跨赤道、受周年运动的赤道辐合带(ITCZ,又称热带辐合带)影响的地理位置所决定的。赤道辐合带受南、北半球信风影响的低气压带,造就了该地区的低气压。横跨印尼和其他热带地区的全年的高温和高湿度形成的气候是非常不稳定的,随时都会形成难以散开的对流云。热带辐合带的风辐合而产生的向上推动作用破坏稳定,热带辐合带顾名思义意味着频繁对流的云层和大量的降水。
The presence of the ITCZ is evident in Figure 3 as a belt of heavy cloudiness that stretches eastward across the Pacific from the Indonesian archipelago. In the islands themselves, however, the ITCZ is only part of the story, as the daily heating of the land, sea- and land-breeze circulations, and the interaction of winds with topography also promote instability and give rise to complex cloud patterns. In both the cloud and precipitation maps, the heaviest cloud and precipitation are found over Sumatera and Kalimantan, with lesser amounts over Sulawesi and the Moluku Islands. The complexity of these cloud patterns is evident in the satellite pictures displayed in Figure 7.
赤道辐合带(如图3所示)形成的大量云层从印尼群岛一直横跨太平洋。对于岛屿而言,热带辐合带仅仅是影响天气因素的一部分,陆地的热量、海陆环流、风向与地形的相互作用都会造成天气的不稳定和复杂的气象状况。在云量和降水图中,苏门答腊和加里曼丹上空有非常多的云层和降水,而在苏拉威西和北马鲁古群岛上空只是略少而已。图7的卫星照片中,这些复杂的云层显得特别明显。
The ITCZ migrates north and south with the annual movement of the Sun, and so Indonesia is treated to seasonal wet and dry spells according to whether the ITCZ is overhead, or gone to higher or lower latitudes. In the western islands, the influence of the ITCZ is quite noticeable in the monthly rainfall statistics, such as those for Palembang in Figure 4. In Sumatera and Kalimantan, March is at the peak of the monsoon season. Farther east, rainfall amounts drop off and the distinct wet and dry seasons become more muted. At Ternate (Figure 4), wet and dry seasons are difficult to discern, but the important distinction is that March comes with only half the precipitation of the more westerly islands.
赤道辐合带会随着太阳的周年运动向南、北两个方向移动,所以印尼的雨季和旱季是由是否正好被热带辐合带控制、向高纬度移动或向低纬度移动而定。在印尼西部的岛屿,热带辐合带对于每月降雨量的影响非常显著,例如巨港(图4)。对于苏门答腊、加里曼丹,三月是雨季的高峰。继续往东,降雨量以及雨季和旱季的分界变得更模糊。在特尔纳特(图4),雨季和旱季几乎无法区分,但重要的区别在于,三月份,东部的岛屿只有西面的岛屿一半的降水量。
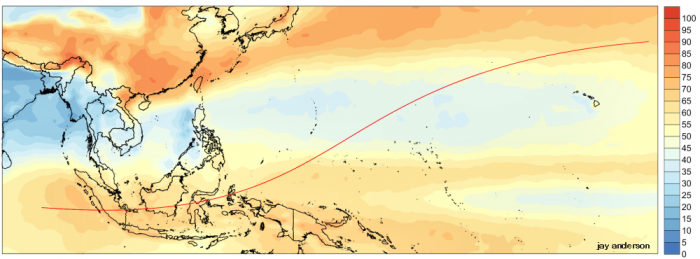
Figure 3: Average Daytime Cloud Cover in 10ths Along the Eclipse Track, derived from 19 years of satellite imagery. Source: NOAA Satellite Active Archive.
图3:根据19年卫星图像统计的全食带平均日间云遮比
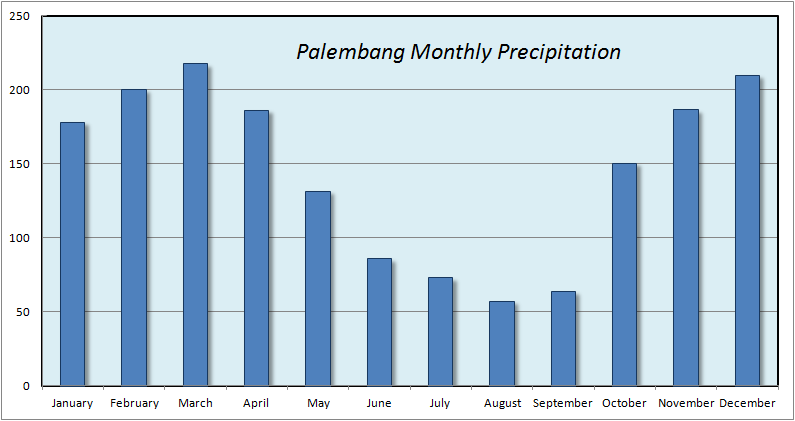
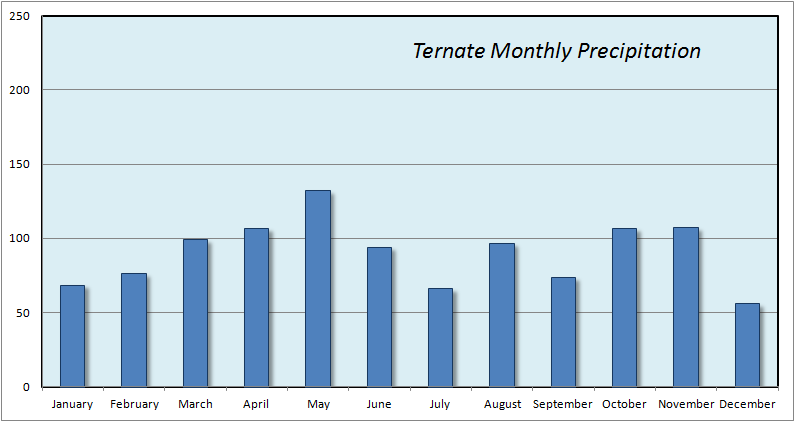
Figure 4: Monthly rainfall graphs for Palembang and Ternate. At Palembang, the wet and dry seasons are well defined, but at Ternate, the seasons are muted and out of phase with those in western Indonesia.
图4:巨港和特尔纳特的月降水图表,巨港的雨季和旱季区别明显,而特尔纳特则模糊。
In satellite images, the most prominent moderator of cloud cover is the daily heating of the land, which builds deep convective clouds as the morning advances into afternoon. This heating, and then cooling at night, sets up a cycle of sea and land breezes, each of which creates its own pattern of cloudiness and rain. Generally speaking, the daytime sea breezes will carry cool air onto the land and make coastlines a little less cloudy than inland regions, but the difference is small, as the cloud that forms further inland then blows back over the coast at a higher level, at least on the eastern sides of the larger land masses. At night, land breezes, blowing out ward from the land, lift the atmosphere and form clouds over the water. Nevertheless, the cloud map of Figure 3, the precipitation map of Figure 5, and the “cloud along the centreline” graph in Figure 6 shows that overwater areas and small islands are distinctly less cloudy than those on the larger land masses.
在卫星云图中,云量覆盖的因素极大程度取决于白天被加温的陆地区域,从早晨到下午逐渐形成强对流云。这种白天升温、夜晚冷却的温度变化,形成了海陆风的周期,每个周期都有不同的的云量和降雨模式。一般来说,白天海风会携带冷空气到陆地,造成海岸线的云量少于内陆,但是这种差异较小,因为内陆形成的云层又会被吹回海岸的高空,至少在较大陆地的东侧是这样。而在夜晚,从内陆吹出的风形成上升气流并在水面上形成云层。图3的云图、图5的降水图、图6的全食带云量图中显示,海面和小岛的云量会比陆地的更少一些。
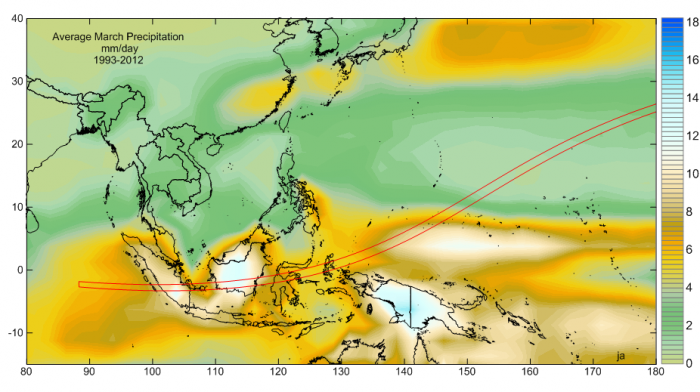
Figure 5: Average March precipitation in mm/day derived from satellite observations. Source: GPCP/NOAA.
图5 三月份平均降水统计图(基于卫星观测结果)
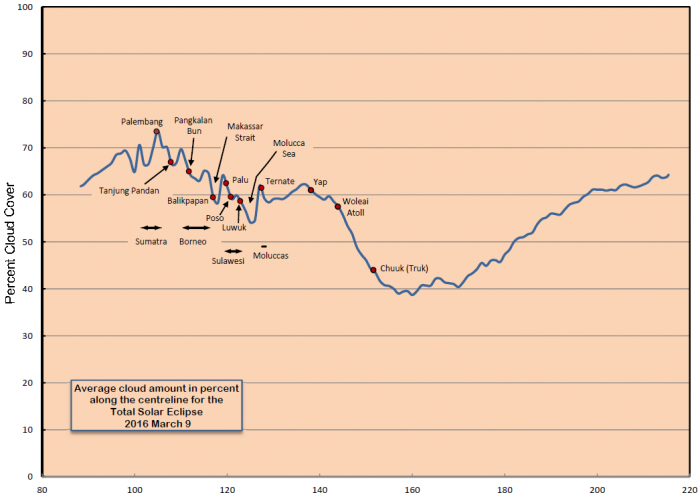
Figure 6: Average Cloud Amount Along the Eclipse Centreline. Cloud statistics are derived from 19 years of satellite imagery.
图6:全食带平均云量图(基于19年间的卫星图像)
Source: NOAA Satellite Active Archive.
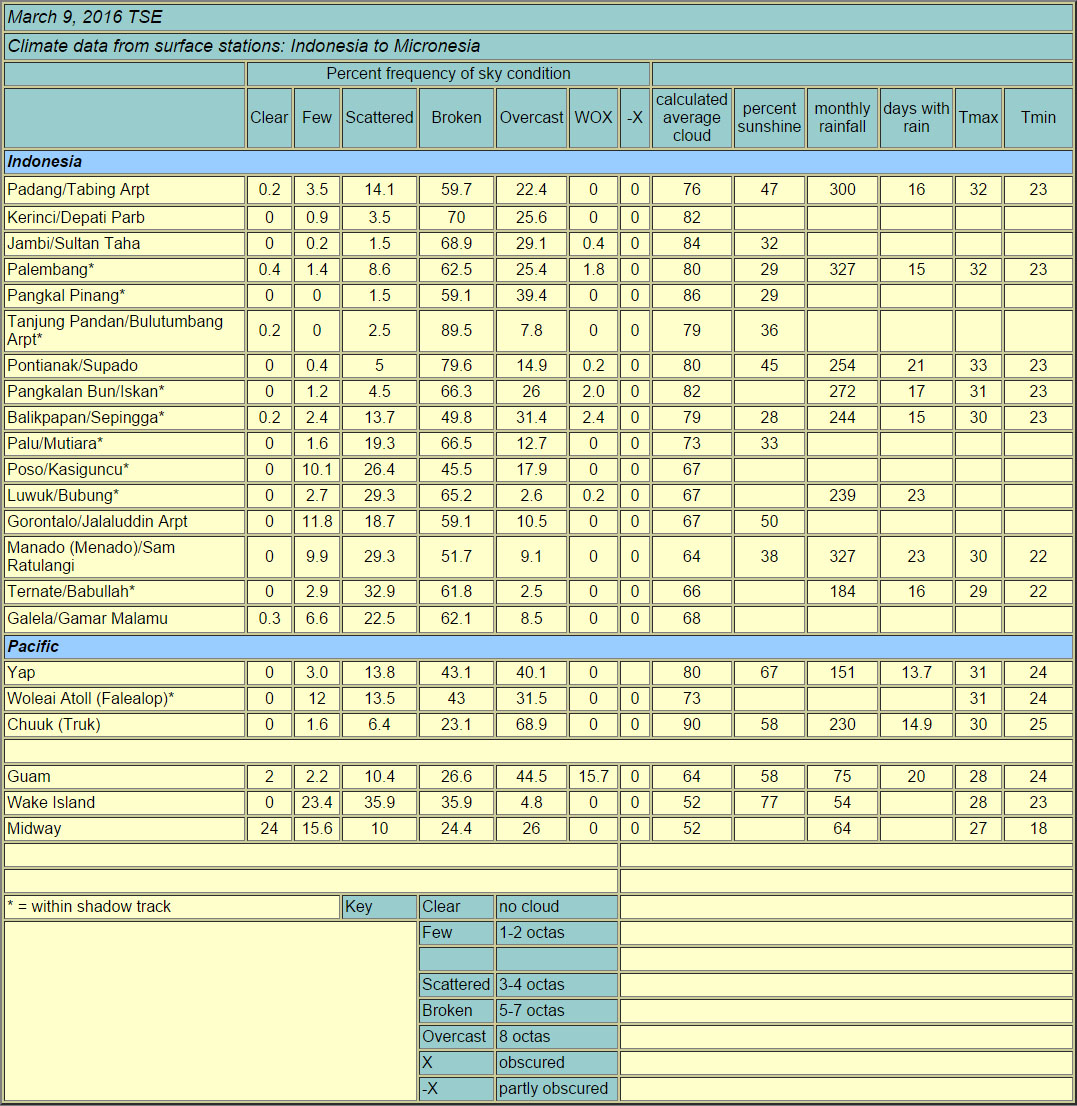
Observations from surface-based weather stations presented in Table 1 (below) show a modest decrease in cloudiness along the track, with mean cloud amounts at eclipse time ranging from mid-80 percent in Sumatera to mid-60 percent over the Maluku Islands. Satellite measurements of cloud cover are less distinct, with mean cloud amounts ranging from 75 percent in Sumatera to about 60 percent in the Malukus, save for a drop below 55 percent over the Molucca Sea. Ship-based observers will definitely have an advantage in this eclipse, giving them access to the lowest cloud amounts and a mobile platform to seek out better skies on eclipse day.
从表1 所示基于地面气象站观测数据显示,日食发生时刻,云量沿着全食带自西向东是逐渐下降的,从苏门答腊的80%下降到马鲁古群岛的60%。卫星观测到的云层不是很明显,平均云量从苏门答腊的75%到马鲁古群岛的60%,在马鲁古海上空会低至55%。船上观测在此次日全食中会占据优势,因为能利用船只这个移动的平台前往云层更少的海上地区,并且在日全食当天寻找到更晴朗的天空。
For those who prefer to observe from land, several small islands such as Bangka, Belitung, and Ternate offer the best prospects. From a meteorological perspective, the areas to be avoided are western Sumatera and the interiors of Kalimantan, and Sulawesi.
对于那些想在陆地上观测的追日者来说,若干岛屿,例如邦加岛、勿里洞岛、特尔纳特岛是最好的选择。从气象角度来说,需要避开的地区是西苏门答腊、加里曼丹内陆、苏拉威西。
Beyond Indonesia, the eclipse track moves into a much sunnier climate as it crosses under the semi-permanent sub-tropical highs along the 30th parallel of latitude. Average cloudiness declines to less than 30 percent north of Truk and then increases steadily to the 60 percent mark as the track comes to its sunset ending north of Hawaii. Two small islands lie under the track, one temptingly close to the maximum point and the centre line. This is Woleai Atoll (and specifically, Falealop), which has an airport, though its use is now suspended because of the need for repairs. Ifalik, the second island, is half-way to the south limit. The islands are on the edge of the anticyclone’s influence, and cloud cover is not different from that in eastern Indonesia. (Web searches on these islands will result in endless confusion, as Falealop is usually mixed up with Falalop)
在印尼之外,全食带穿越了北纬30°的半永久性副热带高压地区,因此会有更晴朗的天气。平均云量在Truk以北下降到30%,然后在日落前结束于夏威夷北部,云量也逐步增加到60%。两个小岛位于全食带,其中一个接近全食带中线上食分最大点,那就是沃莱艾环礁环礁(Falealop礁),它有一个机场,虽然它因为需要进行修理而暂停运营。另一个岛屿是伊法利克环礁,位于全食带中线到南边界一半的位置。这些岛屿位于反气旋的边缘,因此云层的情况和东面的印尼是一样的。
(网上搜索这些岛屿的信息可能是混乱,因为Falealop通常被拼写为Falalop)
The Impact of El Niño
El Niño is a periodic large-scale meteorological event that is characterized by a pool of anomalously warm water in the Equatorial Pacific, weaker-than-normal easterly trade winds and a dramatic change in precipitation patterns across the Central Pacific. For Indonesia in particular, an El Niño brings dry weather or even a drought in the midst of the rainy season. It would seem natural to expect a change in cloud cover across the region in concert with the drier weather.Figure 7 shows that this is indeed the case, with reductions in cloud cover of 5 to 15 percent typically in March of El Niño. The map is constructed by subtracting the cloud cover measurements for El Niño years from the long-term average cloudiness. Since the long-term average includes years with an El Niño, the true difference may be slightly larger (though the dataset also includes La Niña years when cloud cover is higher).
厄尔尼诺现象的影响
厄尔尼诺现象是周期性大尺度的气象事件,其特征是太平洋赤道区域海水异常高温,弱于正常的东风信风和横跨太平洋中部的戏剧性降水模式变化。对于印尼来说,厄尔尼诺现象带来的干燥天气,甚至是雨季之中的干旱。受干燥天气影响的地区自然而然的可能发生云量的变化。如下图所示,在厄尔尼诺的三月,云量相比平常确实减少了5%到15%。该图表数值是减去了厄尔尼诺影响的长期平均云量。由于长期平均云量统计时包括了厄尔尼诺年的数据,真实的差异可能会稍大(尽管数据还包括带来更高云量的拉尼娜年)。
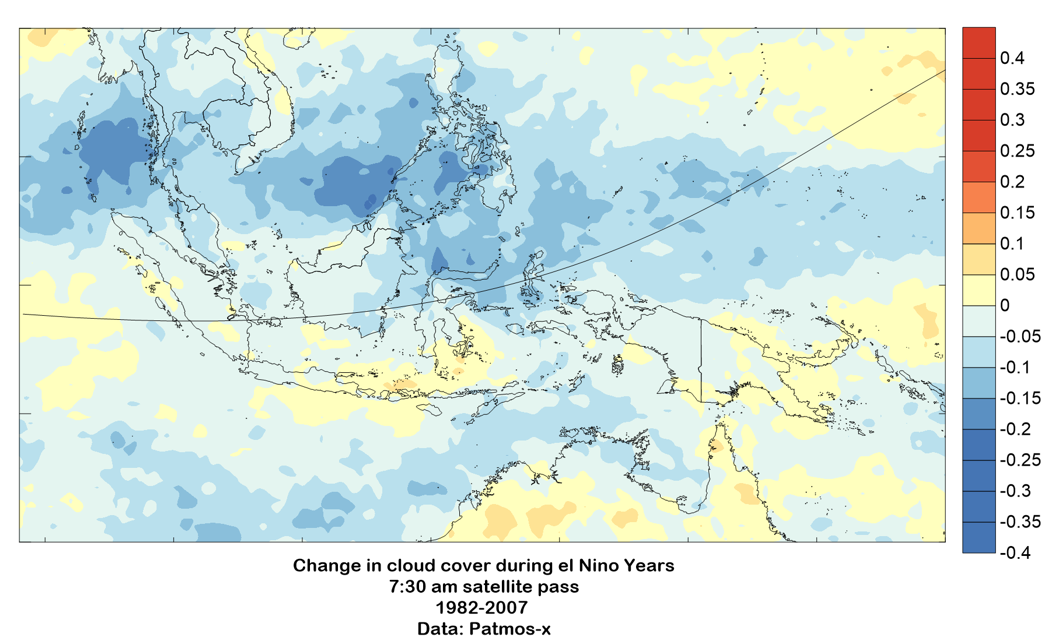
(译者注:作为对比,下图是未修正厄尔尼洛现象影响的数据)
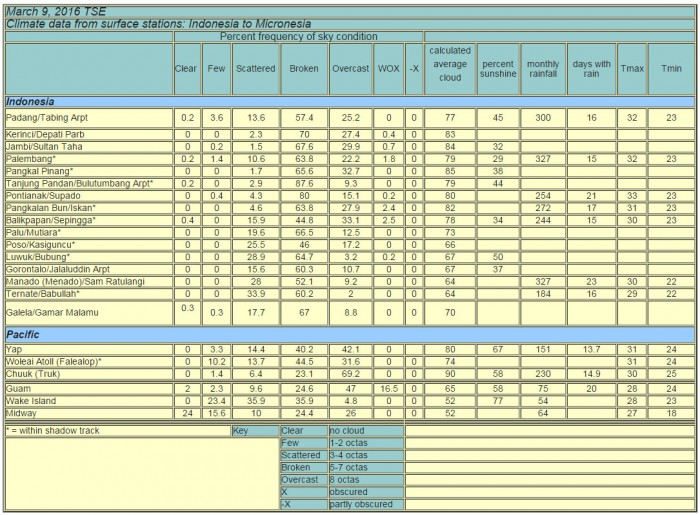
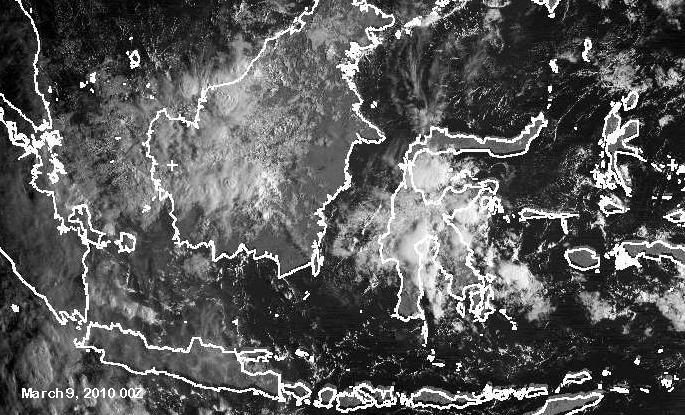
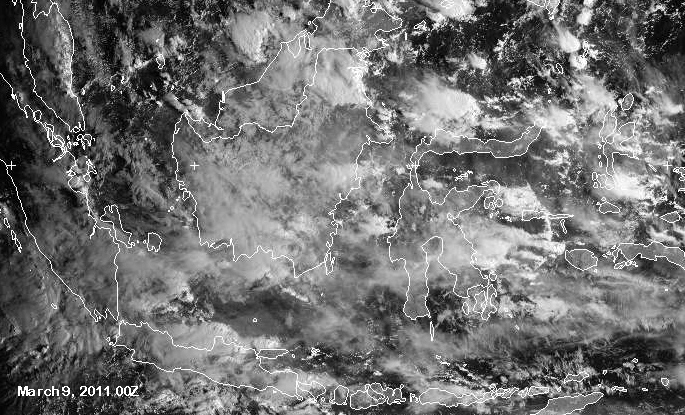
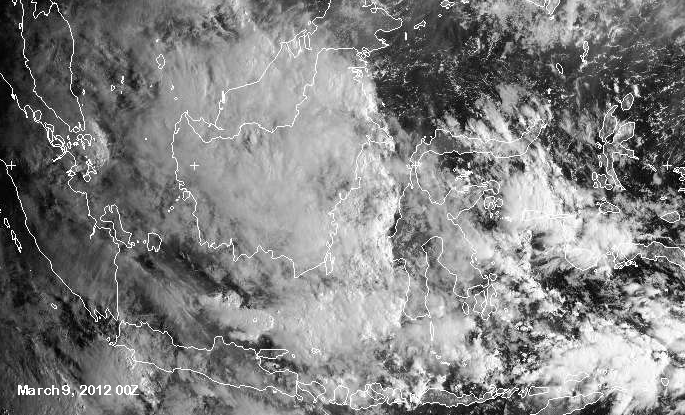
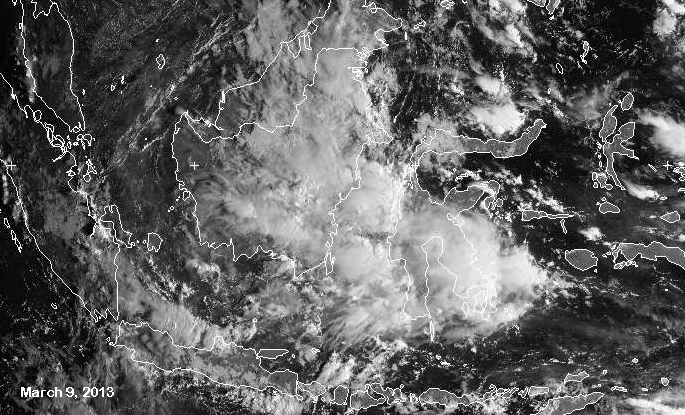
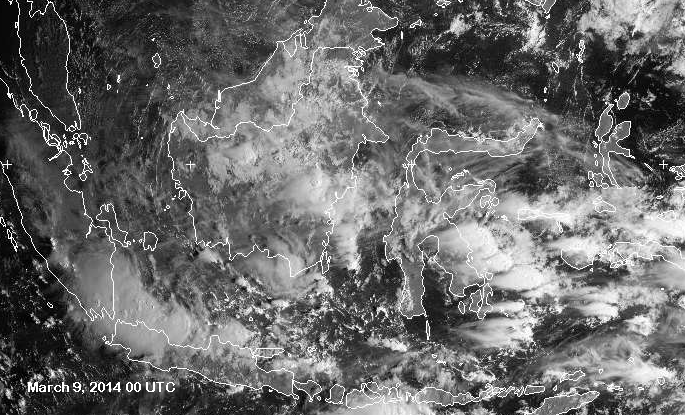
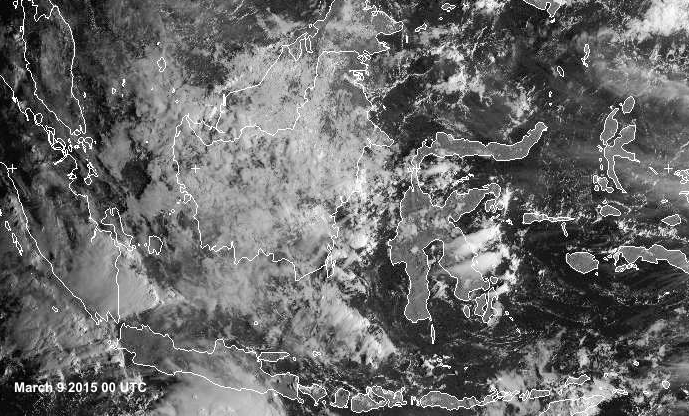
Figure 7: Satellite images for March 9 showing the extent of cloud cover over the past 4 years. These are visible-light images acquired at 00 UTC (eclipse time) from a Japanese geostationary weather satellite.
图7:2010-2015年日全食当天印尼的卫星云图。这些可见光云图是日本地球同步气象卫星在UTC 0时(日食事件)拍摄的。
The six images demonstrate the high frequency of cloud over land, particularly Kalimantan (Borneo) and Sulawesi. Cloud over the intervening straits is lower, sometimes significantly so. These are early-morning images, when the cloudiness over land is near its minimum daily value and that over water at its maximum. Image credit: Dundee Satellite Receiving Station, University of Dundee.
这四张图像显示了陆地上空的大量云层,特别是加里曼丹(婆罗洲)和苏拉威西。海峡上空的云量较少,有时候还特别显著。这些是清晨的卫星图片,此时云量接近每日的最小值而水汽则是最大值。图片来源: Dundee Satellite Receiving Station, University of Dundee.
中文翻译由www.Astrocn.com完成
英文原文网址 http://home.cc.umanitoba.ca/~jander/tot2016/tot2016.htm
英文原文最后更新日期:2015年10月